
Key Takeaways
Here are the facts to know about the Houston region this month
Takeaway #1
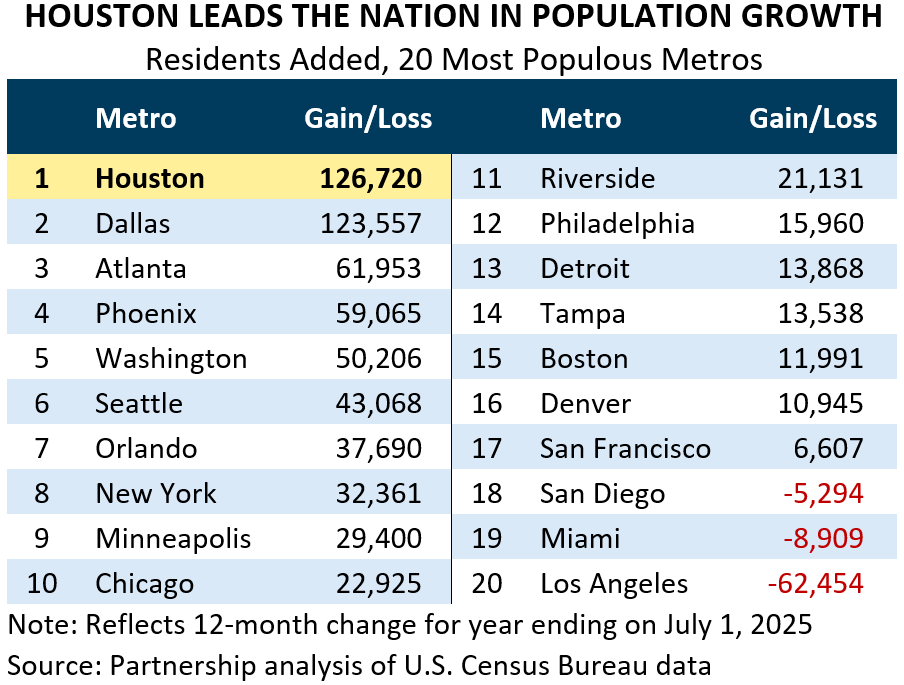
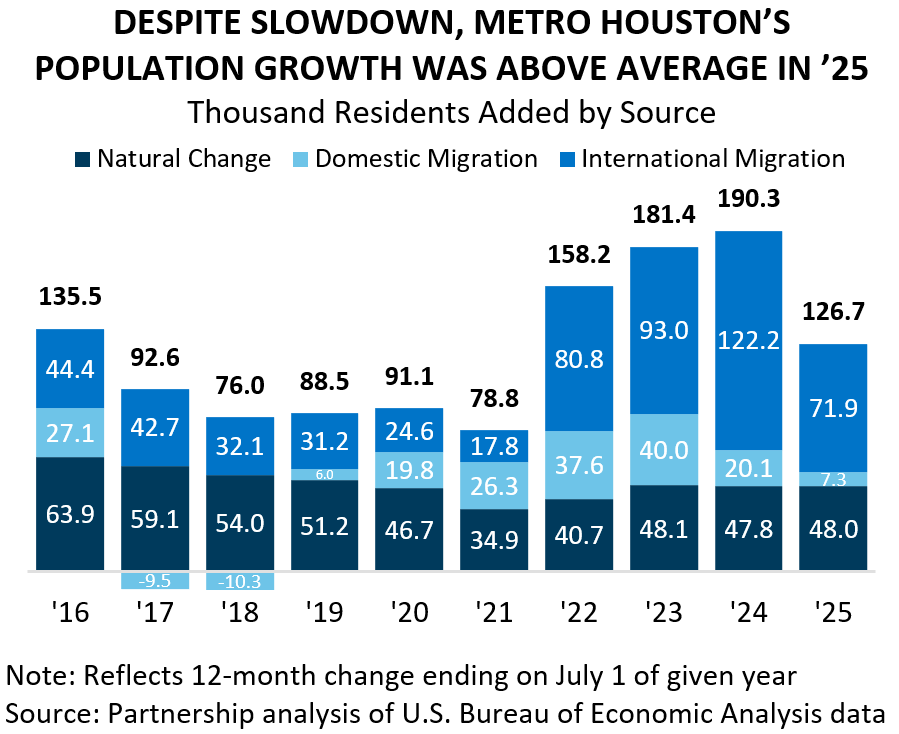
Houston led the nation in population growth, adding just under 127,000 new residents last year. Although growth slowed from the record-setting pace of '24, it remained robust, with more people moving to Houston than to any other metro area in the country.
Takeaway #2
Houston’s job market outperformed earlier estimates and exceeded national trends. Revised data from the Texas Workforce Commission show the metro added 2,700 more jobs in '25 than initially reported, with a growth rate more than 10 times higher than the national pace despite moderating job creation.
Takeaway #3
Houston continues to rank as one of the nation’s top metros for economic development activity. Site Selection Magazine tracked 590 qualifying projects in the region last year, placing Houston No. 2 nationally behind Chicago. On a per-capita basis, Houston ranked No. 1, with 74.6 projects per million residents.
POPULATION GROWTH
The Houston metro area led the nation last year in population growth, with just under 127,000 new residents added in the 12-month period ending on July 1, 2025. That increase equates to a new resident added every 4.1 minutes or 347 new residents each day. Among the top 10 metros with the largest population gains, only Dallas came close, with roughly 124,000 new residents. No other metro added even half as many. The disparity highlights Texas’ strong appeal to workers and families, supported by relatively strong job markets, lower costs of living, and the absence of a state income tax.
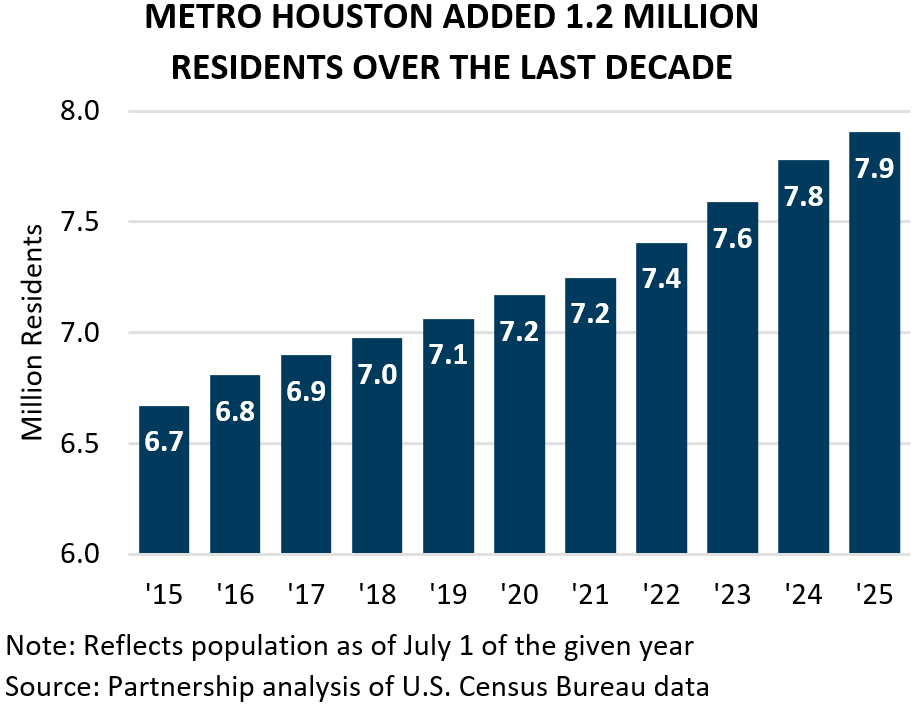
The region has grown from 6.7 million residents in ’15 to 7.9 million residents in ’25. That reflects a population gain of 1.2 million people in a 10-year span. The metro region now has a larger population than 37 U.S. states and the District of Columbia.
Houston not only added more residents than any other U.S. metro in absolute terms, but it also grew at a faster pace than any of its peers. Among the nation’s 20 most populous metros, Houston’s 1.6 percent growth rate was No. 1, topping other fast-growing Sun Belt hubs such as Dallas, Orlando, and Phoenix.
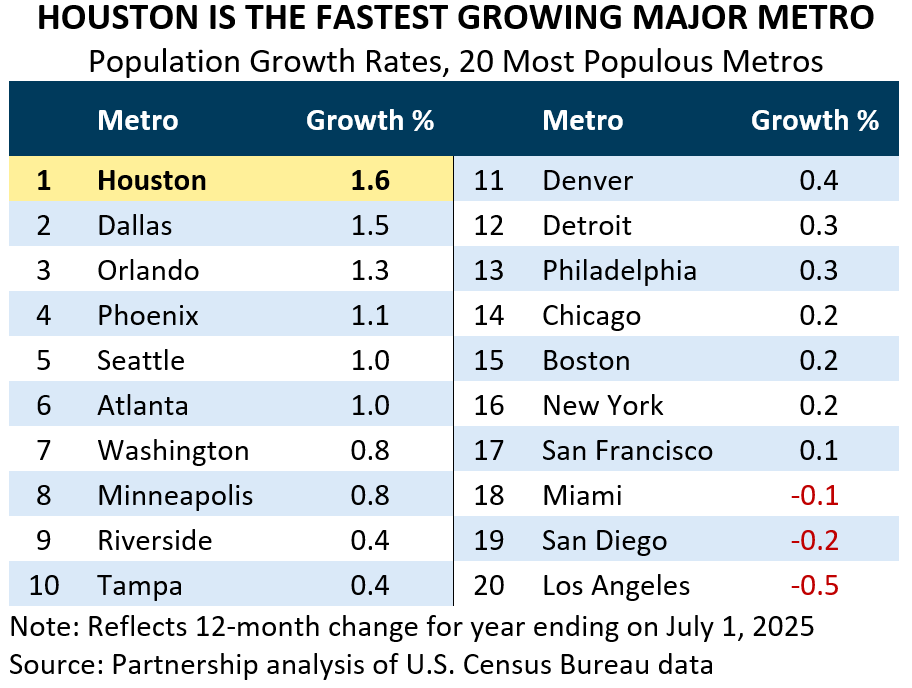
Houston also grew dramatically faster than the nation’s larger, established metros, with a population growth rate roughly eight times higher than that of New York or Chicago, while Los Angeles saw its population decline amid a high rate of domestic outmigration.
Components of Population Growth
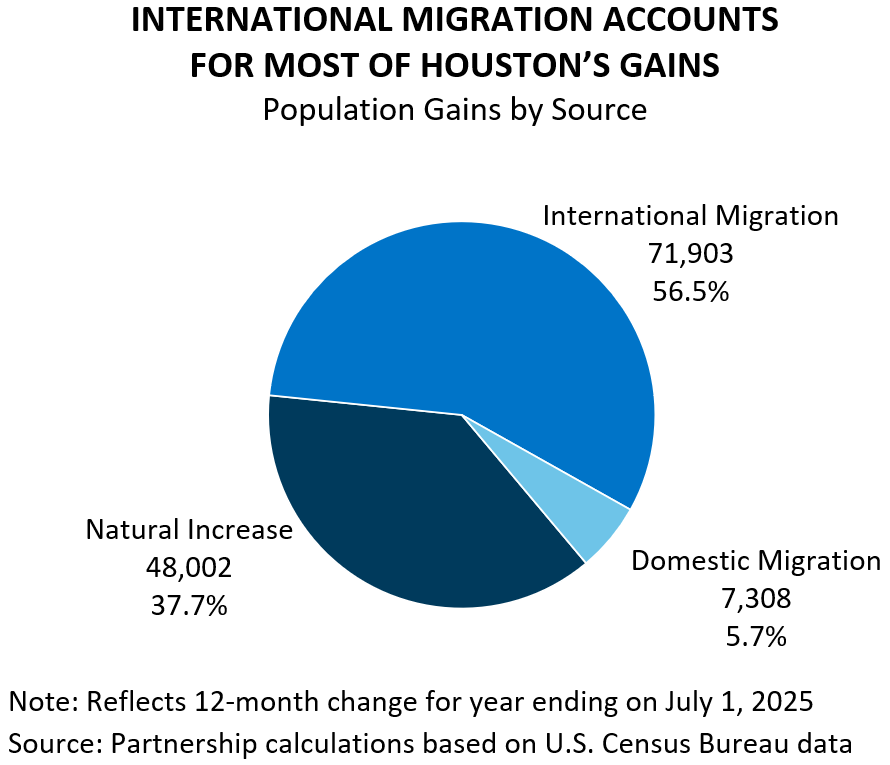
Houston’s population gains come from two sources – migration (people who move in or out of the region) and natural change (the number of babies born minus the number of people who die). Migration can further be broken down into a domestic component (people who move here from elsewhere in the country) and an international component (people who move here from abroad). International migration represented the largest share of Houston’s population growth in ’25 at 56.5 percent of the total, followed by natural change at 37.7 percent then by domestic migration at 5.7 percent.
Population Growth Trends
Although Houston had the nation’s largest population gain in ’25, the metro added about one-third fewer residents than in the record-setting year of ’24, as growth moderated from the rapid pace of the immediate post-pandemic years. Even so, Houston’s growth remained robust by historical standards, with gains in ’25 easily surpassing those from ’17 to ’21. That has not been the case in many other parts of the country, where population growth has slowed more sharply.
The recent moderation partly reflects a return to typical growth patterns after an unusually strong post-pandemic rebound, when accelerated job growth helped offset earlier weakness to attract an outsized number of new residents to the region. With Houston’s job growth during that stretch running well above the national average, the region’s many employment opportunities made it an especially attractive destination for workers from across the country and around the globe. But that exceptional pace was unlikely to persist indefinitely. By mid-’24, the national rate of job creation had returned to normal levels, and by ’25 the labor market had settled into a slower, low-churn environment marked by more restrained hiring and few layoffs. Even so, Houston’s underlying strengths have helped it continue to outpace the rest of the country in job opportunities and population growth, while positioning the region for rapid expansion when macroeconomic conditions improve.
Compared with ’24, natural population change was flat, while domestic and international migration moderated in line with the more modest pace of job growth. Domestic migration posted a sharper decline, falling 63.7 percent, though it remained well above levels seen during the previous labor market slowdown between ’17 and ’19 in the wake of the Fracking Bust. International migration declined by 41.1 percent but remained above pre-pandemic norms. Even so, the timing of the data may blur the effect of recent immigration enforcement policies because the ’25 estimates cover the 12 months ending on July 1st. As a result, some of the apparent strength in ’25 likely reflects inflows that occurred before recent immigration policies took effect.
Note: The geographic area referred to in this publication as “Houston,” "Houston Area” and “Metro Houston” is the ten-county Census designated metropolitan statistical area of Houston-Pasadena-The Woodlands-Sugar Land, TX. The ten counties are: Austin, Brazoria, Chambers, Fort Bend, Galveston, Harris, Liberty, Montgomery, San Jacinto, and Waller.
To continue reading, please download the full report below:


