
Key Takeaways
Here are the facts to know about the Houston region this month
Takeaway #1
With $177.3 billion in exported goods and commodities, Houston remained the top exporting metro in '25. It has held that ranking for nine consecutive years and exports more than Los Angeles, Chicago, and Dallas combined.
Takeaway #2
Port Houston hit a record in container traffic, handling 4.3 million twenty-foot-equivalent-unit (TEU) containers last year. The volume of containerized imports and exports both rose to new highs in spite of the effect of tariffs.
Takeaway #3
Houston added roughly 72,000 new residents last year via international migration. While that is a slowdown from the record pace of '24, it was still the largest contributor to local population growth and remained high relative to pre-pandemic flows.
GLOBAL HOUSTON
On May 7, the Greater Houston Partnership released its Global Houston ‘26 report. The full report can be found at the Partnership’s website. A summary of the document follows.
The global economy remains full of opportunities for exchange and investment. Even after a year marked by heightened trade tensions and military conflict leading to supply chain disruptions through the Persian Gulf, global economic growth is expected to remain positive and relatively steady. In this shifting global landscape, some in the U.S. may struggle to adapt. But Houston’s deep global connections put it in a position of unusual strength:
- Houston consistently exports more goods and commodities than any other U.S. metro.
- The Houston/Galveston Customs District routinely handles more foreign tonnage than any other U.S. customs district.
- Almost 1,000 foreign-owned firms operate over 2,600 business locations in Houston, including offices, factories, warehouses, and service centers.
- Almost 150 Houston-based firms operate over 5,400 business establishments across 109 foreign countries.
- Approximately 2 million Houston residents, one in every four, were born outside the U.S.
- Eighteen foreign banks, 17 sister cities, 41 foreign chambers of commerce and trade associations, and 11 trade and commercial offices promote trade and investment in the region.
- Eighty-six foreign governments have consulates or honorary consuls in Houston.
These ties have benefited the region’s economy in years past and will continue to be important to its success in ’26.
Metro Houston Exports
In ’25, Houston led the nation in exports, shipping more than $177 billion in goods and commodities overseas. Only New York came close, at $161.4 billion, even though its population is nearly three times larger. Among the country’s next largest metros, Houston stands apart: it exported more in ’25 than Los Angeles, Chicago, and Dallas combined.
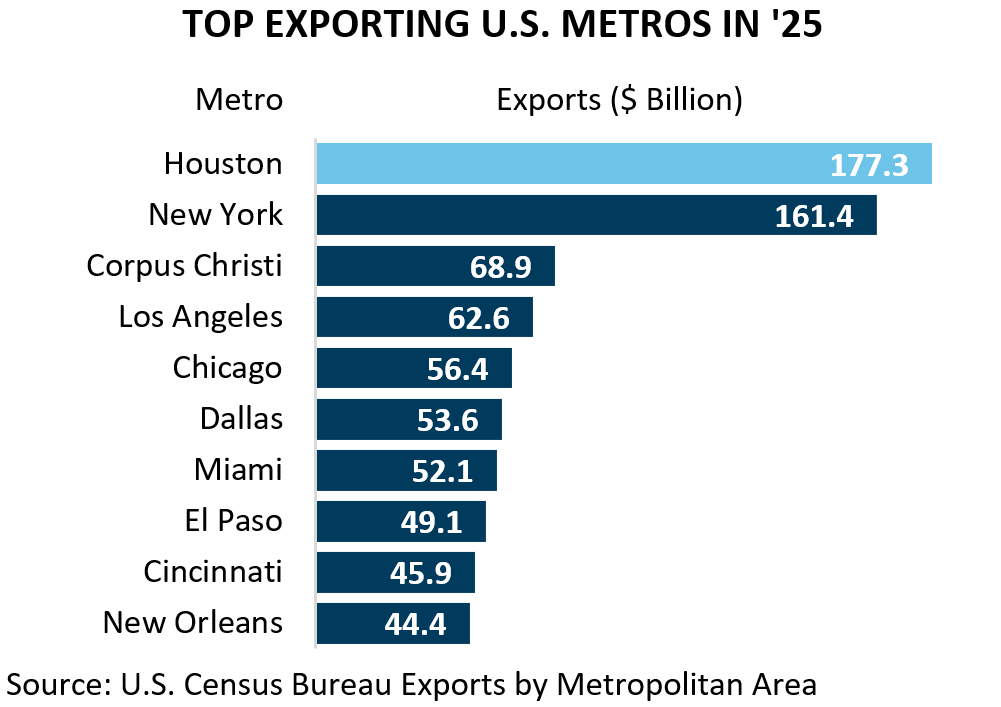
That performance is not simply a one-off spike. Houston has ranked as the nation’s top exporting metro in 13 of the past 14 years, with the only interruption coming in ’16 during a sharp downturn in domestic energy markets. Exporting at that scale gives Houston a larger place in the global economy than its size alone would suggest.
The above data comes from the U.S. Census Bureau’s origin of movement (OM) series, which tracks goods based on the metro where their export journey began. For example, a medical device may be manufactured in Houston, then flown to New York where it’s transferred onto a plane destined for Europe. Though the export leaves the U.S. via the Port of New York, it began its export journey in Houston so, Census records that as a Houston export.
The International Trade Administration (ITA) estimates that Texas exports supported over 1 million jobs in ’23 (latest year for which data is available). That leads all U.S. states and was almost double the 526,941 jobs supported by the runner-up California. Since Houston accounted for roughly 39 percent of the state’s exports, a back-of-the-envelope calculation suggests that approximately 425,000 Houston jobs — more than one in eight — were tied to exports. But this simple calculation probably understates the full economic impact of Houston’s foreign-facing businesses, as it does not account for capital investment or services provided for foreign clients.
Customs District Traffic
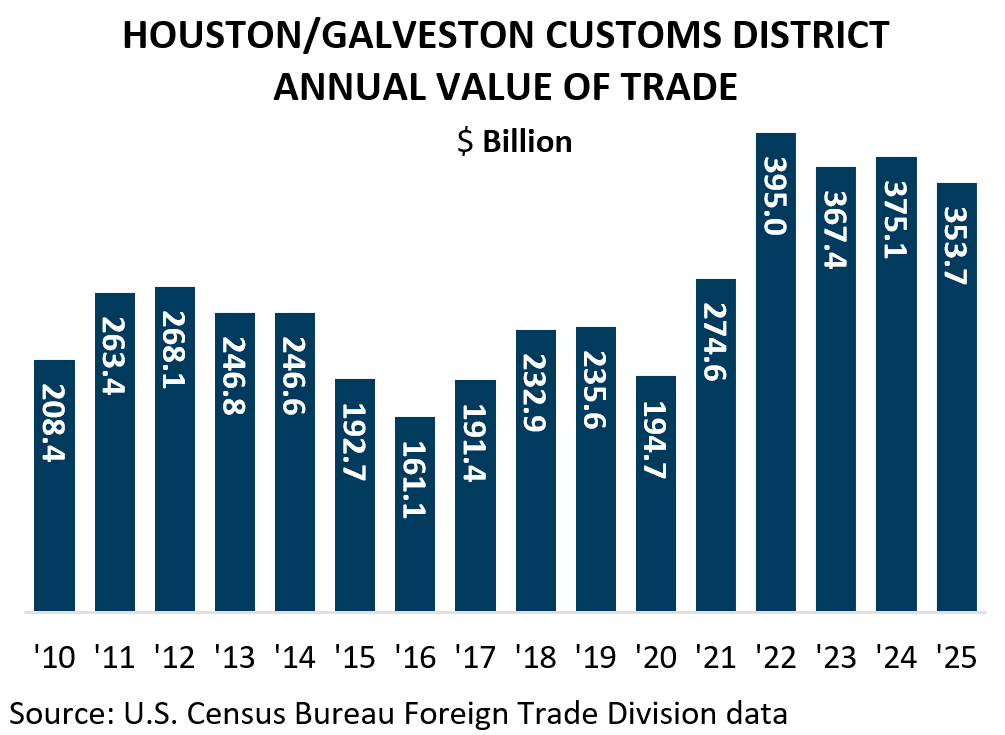
The Houston/Galveston Customs District saw only a modest pullback in trade volumes in ’25. The district’s eight ports handled 426.5 million metric tons of goods and commodities, down 0.8 percent from the record 429.9 million moved in ’24. The value of those shipments totaled $353.7 billion, a 5.7 percent decline from the prior year. Even so, the dip was relatively limited, especially as shifts in trade policy and shipping patterns created sharper disruptions for other metros around the country.
Customs district data differs from the origin of movement (OM) data in that it reflects what passes through a region, which doesn’t necessarily correspond with where an item was produced or consumed. However, for Houston, customs district exports align with the region’s industrial base.
The Houston/Galveston district handled over $1.0 billion each (imports plus exports) of crude oil and refined petroleum products, industrial equipment and computers, organic chemicals, electrical machinery and parts, plastics and plastic products, automobiles and automobile parts, articles of iron and steel, beer, wines, spirits and vinegars, aerospace vehicles and part, instruments and measuring devices, iron and steel, home furnishings, rubber and rubber products, pharmaceuticals, inorganic chemicals, cereals grains, meats, copper and copper products, toys and games, aluminum and aluminum products, fruits and nuts, coffee/teas and spice, essential oils and cosmetics, and wood and wood products.
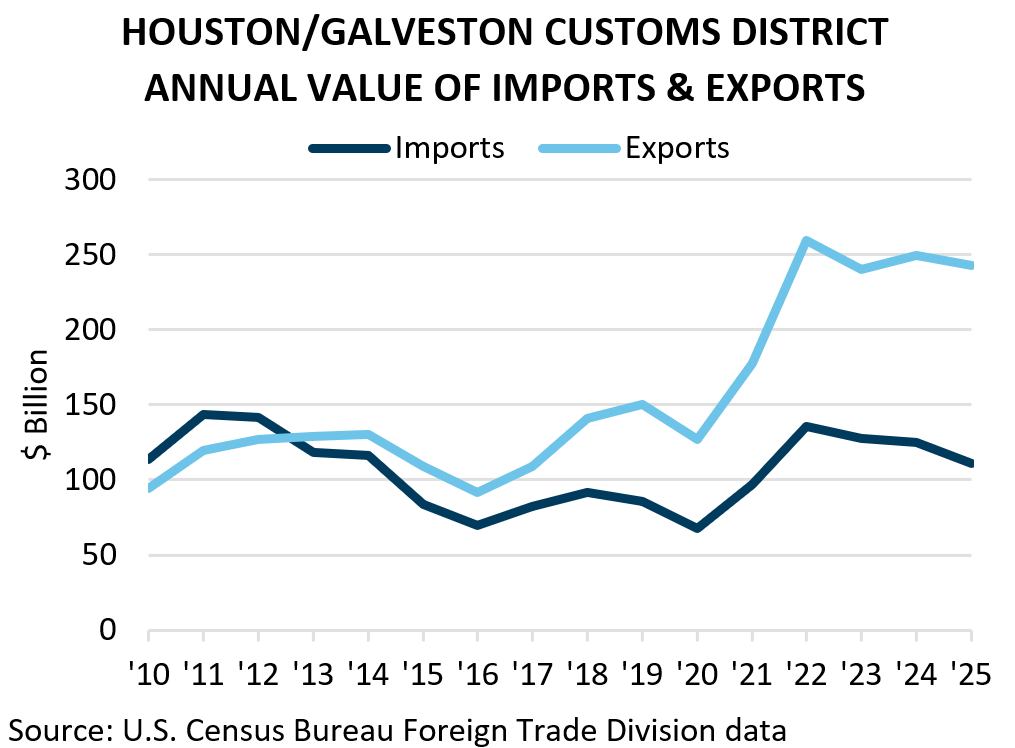
Exports via the Houston/Galveston district consistently exceed imports. They accounted for 68.6 percent of all cargo value handled by the district in ’25. By comparison, exports accounted for 21.7 percent of the Los Angeles district’s exports, and 36.0 percent of New York’s.
The district exported $1.0 billion or more to 43 countries in ’25. Those countries were: Argentina, Australia, Bahamas, Belgium, Brazil, Canada, Chile, China, Colombia, Costa Rica, Dominican Republic, Ecuador, Egypt, France, Germany, Guatemala, Honduras, India, Indonesia, Italy, Japan, Malaysia, Mexico, Netherlands, Nigeria, Norway, Panama, Peru, Poland, Saudi Arabia, Singapore, South Korea, Spain, Sweden, Taiwan, Thailand, Trinidad and Tobago, Turkey, United Arab Emirates, United Kingdom, Venezuela and Vietnam.
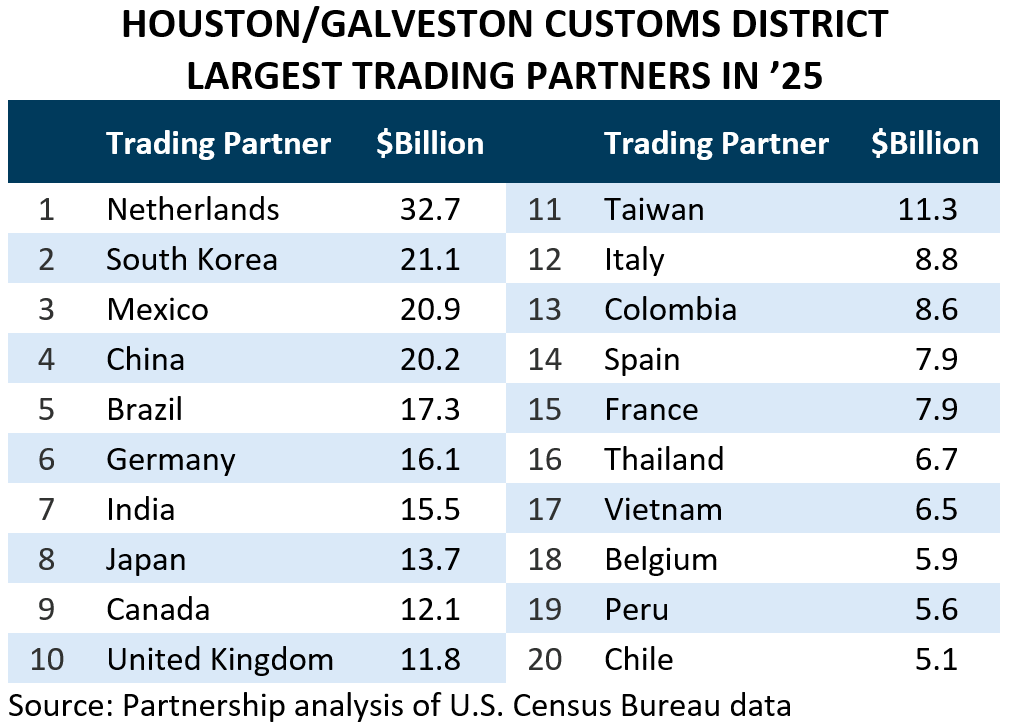
The district’s top 20 trading partners last year, ranked by total trade (imports plus exports), were:
Note: The geographic area referred to in this publication as “Houston,” "Houston Area” and “Metro Houston” is the ten-county Census designated metropolitan statistical area of Houston-Pasadena-The Woodlands-Sugar Land, TX. The ten counties are: Austin, Brazoria, Chambers, Fort Bend, Galveston, Harris, Liberty, Montgomery, San Jacinto, and Waller.
To continue reading, please download the full report below:


