
SALES AND USE TAX COLLECTIONS
The Partnership sends updates for the most important economic indicators each month. If you would like to opt-in to receive these updates, please click here.
Sales and use taxes collected by the 123 Houston-area cities that collect them totaled $582.8 million during the first four months of ‘26, almost equal to the $581.5 million collected in the same period last year. Adjusted for inflation, collections are down 1.7 percent.
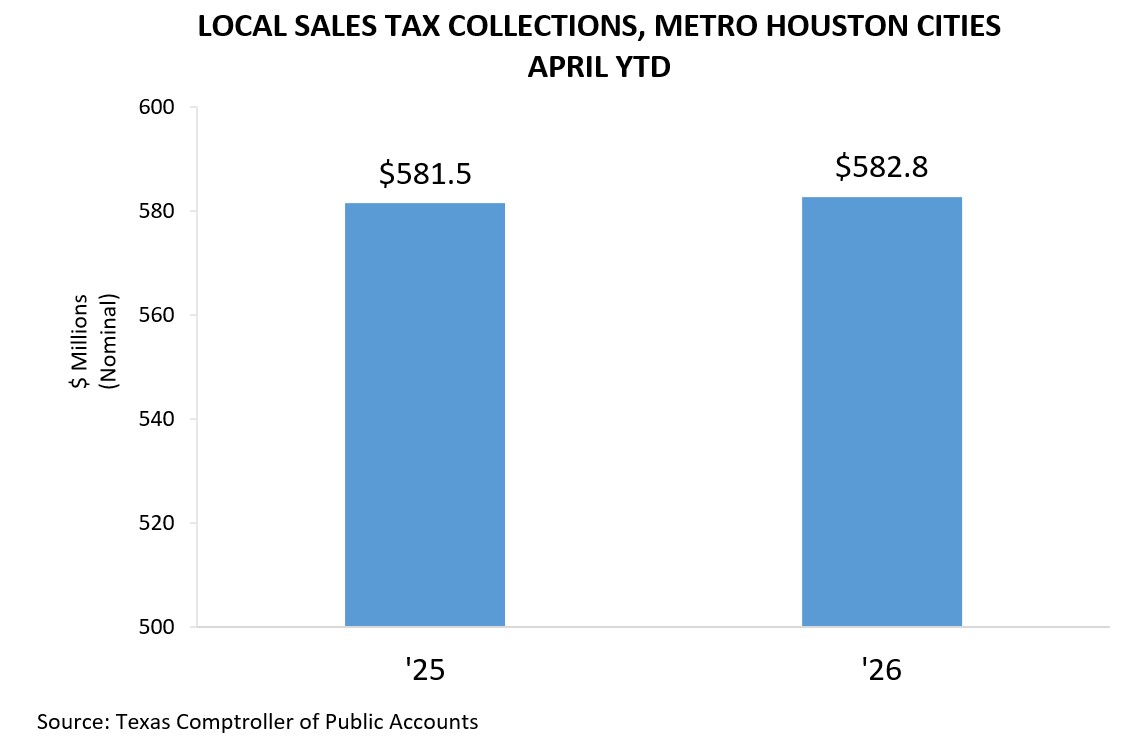
These collections, which cover the purchases of both consumers and businesses, are a proxy for broad economic activity in the region. However, the year-to-date decrease shown above should be interpreted with caution, as spending in early ‘25 was boosted by consumers and businesses pulling purchases forward ahead of new tariff policies. On a monthly basis, however, April ’26 collections exceeded those in April ‘25 and ‘24, suggesting continued regional strength even as the year-to-date comparison is shaped in part by last spring’s tariff-related spending.
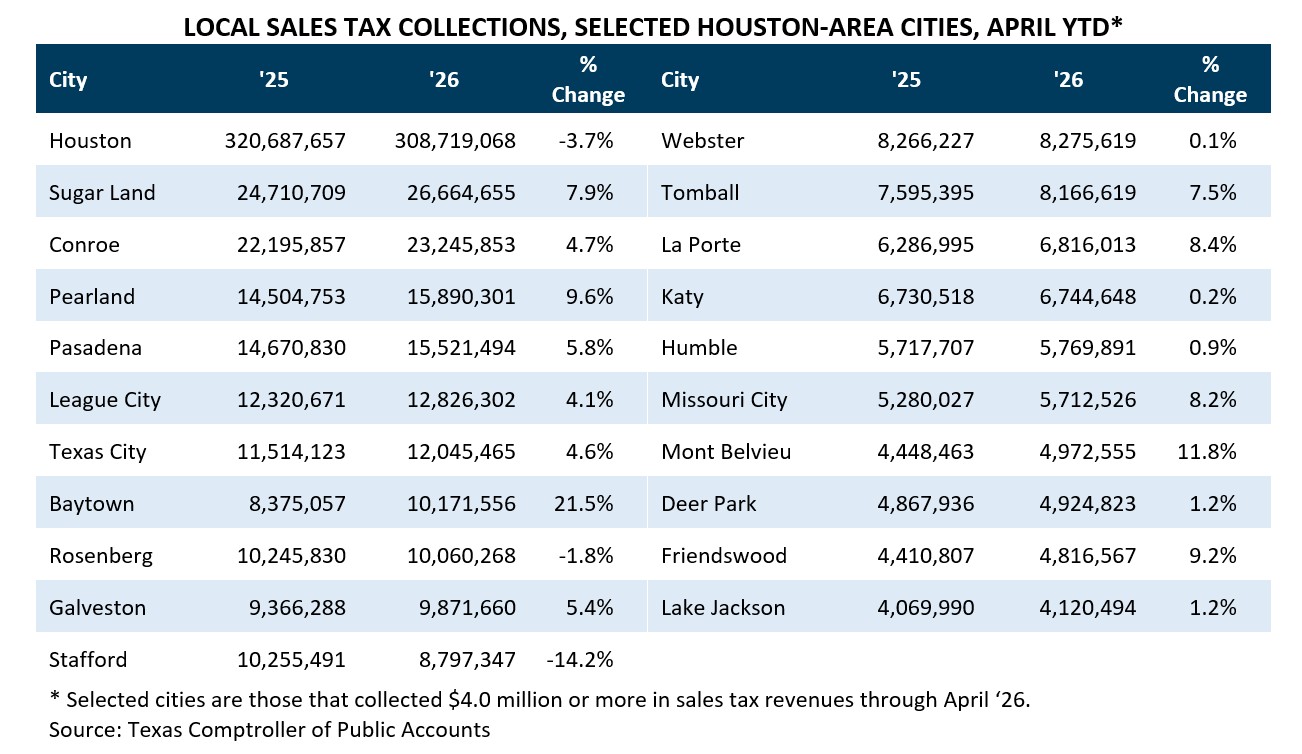
Among the 21 cities in the metro area that collected $4 million or more in taxes through April ‘26, activity is up ten percent or more in two, up by more than five percent in eight, up by less than five percent in eight, and down in three, before adjusting for inflation. These 21 cities accounted for 88.2 percent of all sales tax collections during that time.
The Texas Comptroller of Public Accounts releases allocated payments from the sales and use tax monthly. There is a two-month delay between when the tax is collected and when it is allocated. Data for May will be released in July.
Prepared by Greater Houston Partnership Research
Clara Richardson
Analyst, Research
Greater Houston Partnership
crichardson@houston.org
Colin Baker
Manager of Economic Research
Greater Houston Partnership
bakerc@houston.org

Get more in-depth analysis from the Partnership team with a Membership.
