
The Partnership sends updates for the most important economic indicators each month. If you would like to opt-in to receive these updates, please click here.
Houston’s retail market remains a steady performer among the city’s commercial real estate sectors, supported by ongoing population and job growth. The vacancy rate edged slightly lower to 5.5 percent in Q4/25, reflecting continued stability in occupied space. Leasing activity moderated, with net absorption totaling 557,904 square feet, following stronger gains earlier in the year. Average rents increased to $20.46 per square foot, maintaining an overall upward trend. Construction activity rose modestly to 3.4 million square feet underway, indicating a measured but active development pipeline.
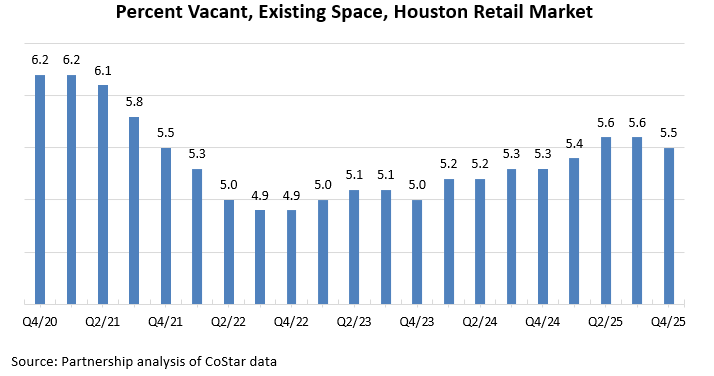
Vacancy rates rose early in the pandemic but began trending down in ’21 as the economy recovered. After peaking at 6.3 percent in Q3/20, rates declined steadily through most of ’23 before inching up again in ’24. The rate increased from 5.3 percent in Q4/24 to 5.5 percent in Q4/25, reflecting a modest rise in vacancy. Robust population growth and steady in-person shopping continue to support demand for retail space, even as consumer behavior shifts toward more online purchasing and experiential retail.
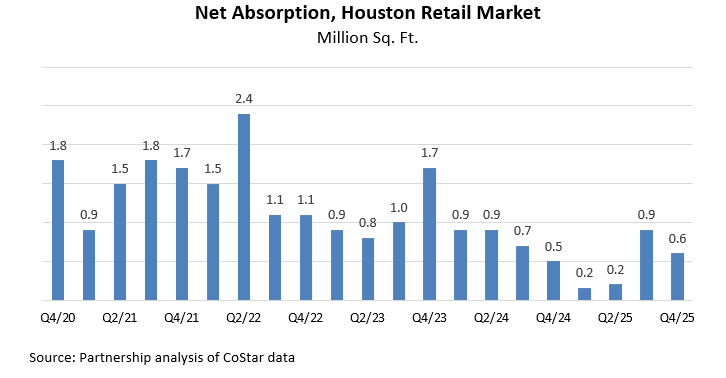
The market posted 557,904 square feet of positive net absorption in Q4/25, following stronger leasing activity in the prior quarter. Absorption moderated from 821,439 square feet in Q3/25 and remained slightly above the 547,141 square feet absorbed in Q4/24. While activity remains positive, absorption levels are below the stronger pace seen in prior years, reflecting more cautious expansion strategies by retailers.
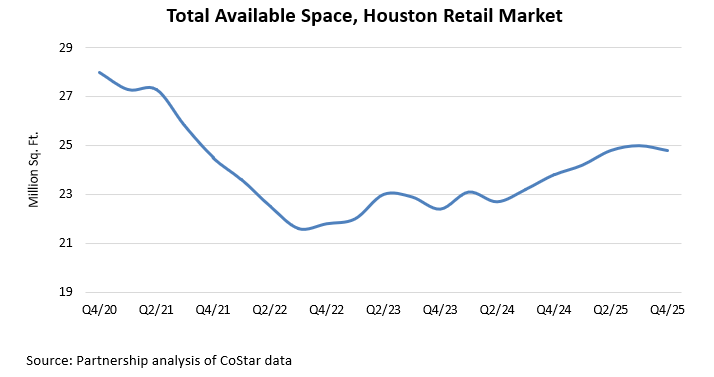
At the end of Q4/25, the total space being marketed, including vacant space, occupied yet available space, sublease space, or space expected to become available, totaled 24.8 million square feet, up from 23.8 million square feet in Q4/24.
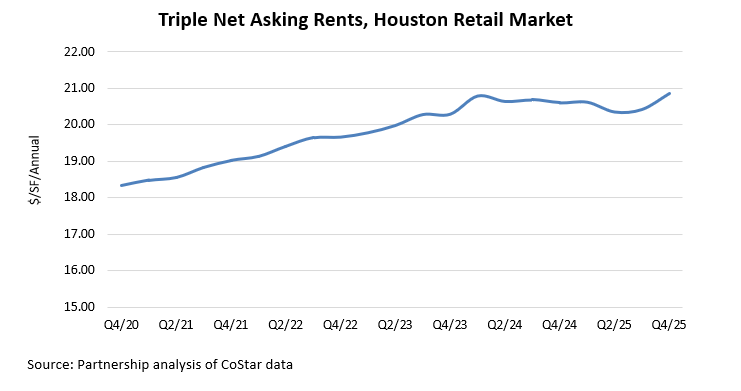
After years of steady growth, retail rents in Houston have largely stabilized since ’24. While rents edged higher through ’25, the average triple net (NNN) rent measured $20.86 per square foot in Q4/25, slightly above year-ago levels and holding near recent highs. These rates are quoted as NNN, meaning tenants are responsible for covering expenses such as property taxes, maintenance, utilities, and security. The leveling of rents suggests a more mature phase of the cycle, with pricing holding near record levels despite a more cautious leasing environment.
Prepared by Greater Houston Partnership Research
Leta Wauson, Research Director

