
The Partnership sends updates for the most important economic indicators each month. If you would like to opt-in to receive these updates, please click here.
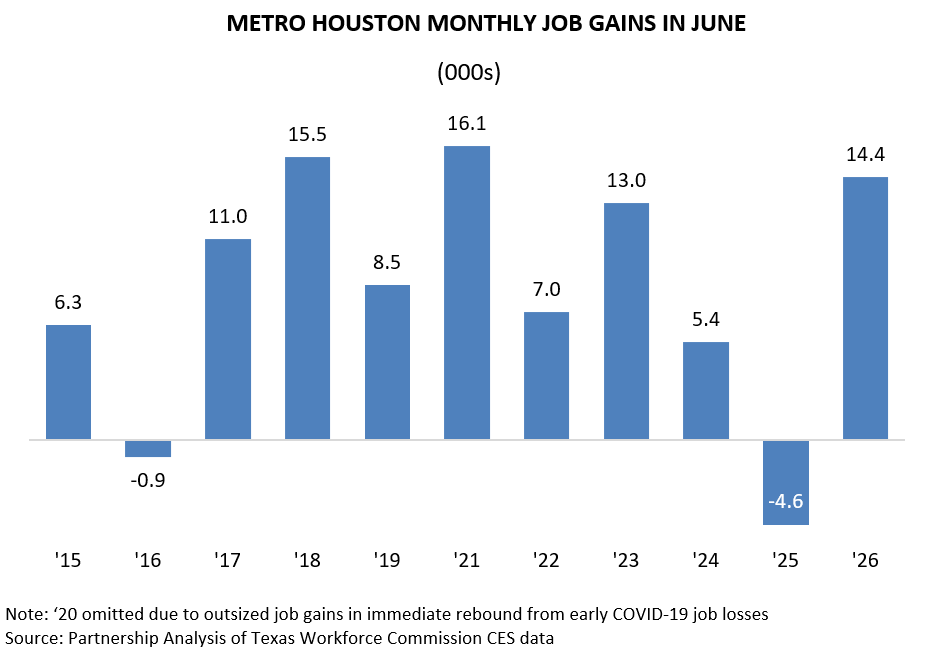
Metro Houston added 14,400 jobs in June, marking a second straight month of above-average growth, according to data released today by the Texas Workforce Commission (TWC). June typically brings job gains as summer hiring in construction, recreation, and leisure and hospitality more than offsetting seasonal declines in education. But this year’s gain was unusually strong, coming in nearly 40 percent above the 10,500 jobs Houston averaged each June in the decade before the pandemic.
Over the past 12 months, Houston has added 39,700 jobs, led by gains in construction. Hiring on infrastructure and civil engineering projects has cooled from last year’s exceptional pace, but growth in building construction and specialty contracting has picked up some of the slack. Administrative support ranked second as temporary staffing and other employment services rebounded sharply from last year’s lull. Health care placed third, with Houston’s growing population driving demand for doctors, nurses and other practitioners.
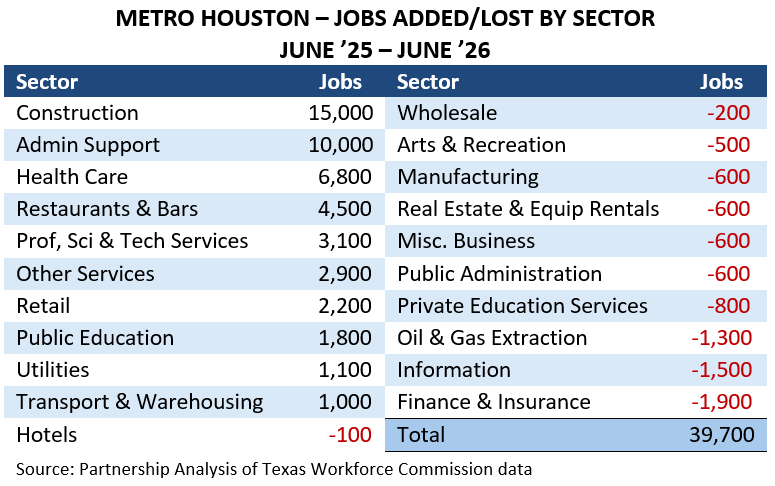
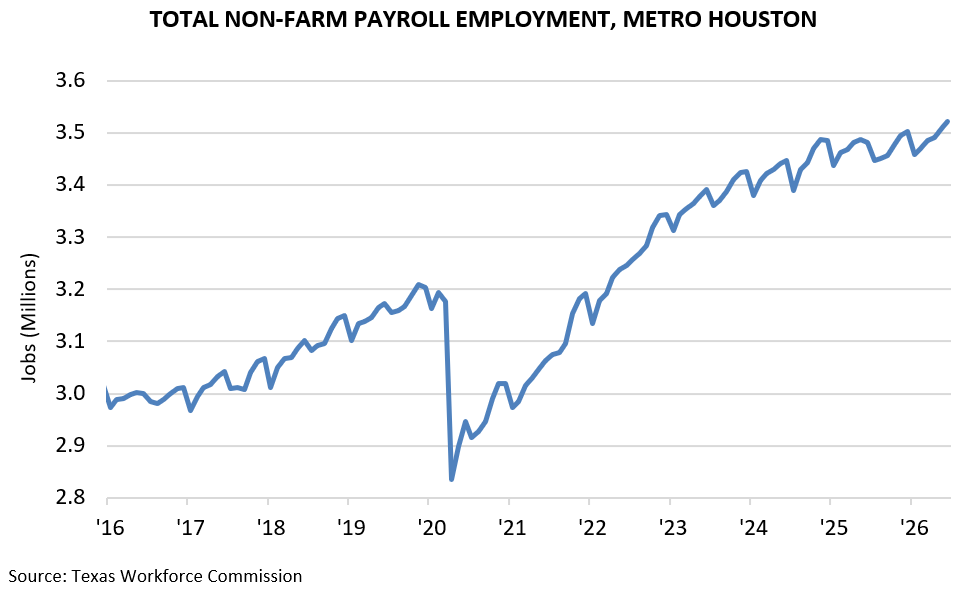
Although many sectors lost jobs over the year, the pullbacks were generally modest, with only three sectors shedding 1,000 or more jobs. Total non-farm payroll employment for the region now stands at 3,521,500.
Prepared by Greater Houston Partnership Research Division.
Colin Baker
Director of Economic Research
Greater Houston Partnership
bakerc@houston.org