
The Partnership sends updates for the most important economic indicators each month. If you would like to opt-in to receive these updates, please click here.
Estimated Read Time: 2 minute
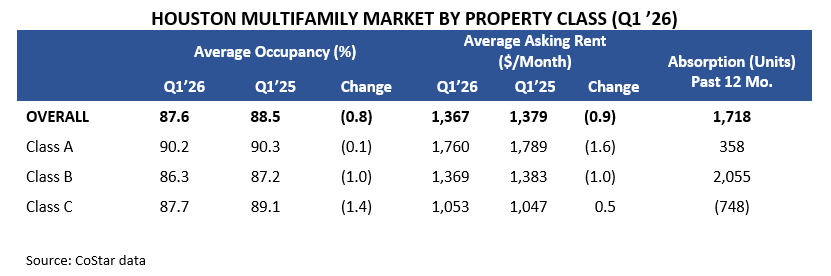
The multifamily market in Metro Houston remained relatively stable in Q1 ‘26, with modest changes in occupancy and rents compared to the same period last year. Overall apartment occupancy declined slightly between Q1 ‘25 and Q1 ‘26, according to CoStar data. Average rents also declined modestly over the year. Class B apartments led absorption, with additional gains in Class A properties helping to offset declines in Class C. Ongoing new supply has also contributed to modest softening in occupancy and rents.
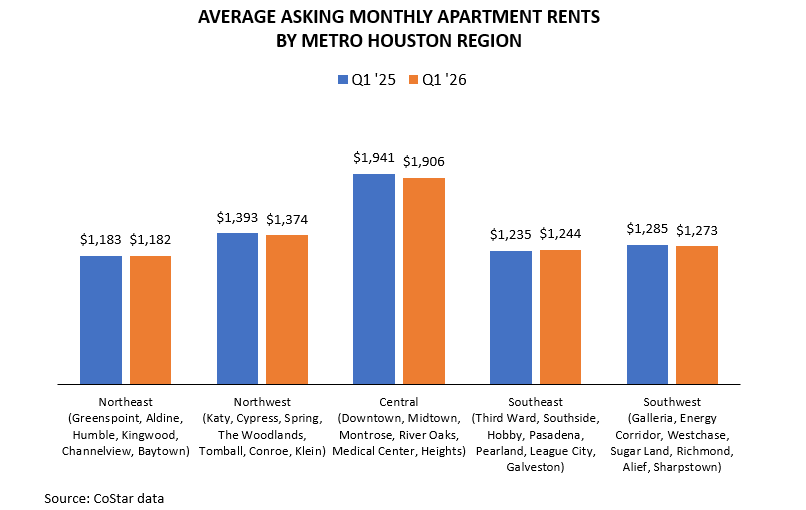
Rents remained relatively stable across metro Houston, with a modest increase in the Southeast region representing the only increase over the year. The Central, Northwest, and Southwest regions registered slight declines, while the Northeast remained essentially unchanged. The Northeast is still among the most affordable areas for renters.
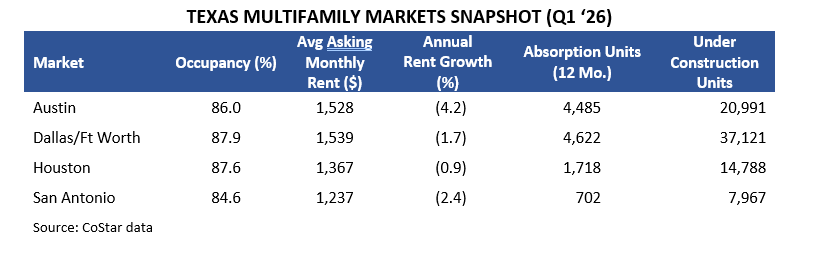
Other major Texas metro areas experienced rent declines and softening occupancy over the past year. Austin saw the steepest decline in rents, while Houston experienced a more modest decrease, with relatively steady occupancy levels. Despite recent softening, Houston continues to offer a cost advantage, with average rents about 11 percent lower than in Austin and Dallas-Fort Worth.
Prepared by Greater Houston Partnership Research Department


Want to learn more? Contact our Research Team:
Leta Wauson
Director, Research
Greater Houston Partnership
lwauson@houston.org
Clara Richardson
Analyst, Research
Greater Houston Partnership
crichardson@houston.org